
How to engineer your luck
A thousand no for every yes
When I moved to London I was on the hunt for shared accommodation. Browsing ads and meeting future flat mates is time consuming. Lacking the latter, I thought: “What is the minimum number of flat shares I should get in touch with in order to get at least one option that suits me?”. I got in contact with 8 and ended up with a few choices. Only one was perfect. Luck or engineered luck? How did I pick the number 8?
After meeting your future flat mates, one doesn’t know what happens in their mind. Do they like me? Do I like them? Their decision and mine is biased. It is very much like flipping an unfair coin. Let’s consider that a head is a positive outcome: I get the room. When getting in touch with 8 accommodations, you flip an unfair coin 8 times. I might get zero, one or multiple heads.
Let’s do a simulation with a fair coin first.
Flip a fair coin 8 times and record how many heads you get. Repeat this operation many times. When plotting the recorded data one gets a histogram that looks like this:
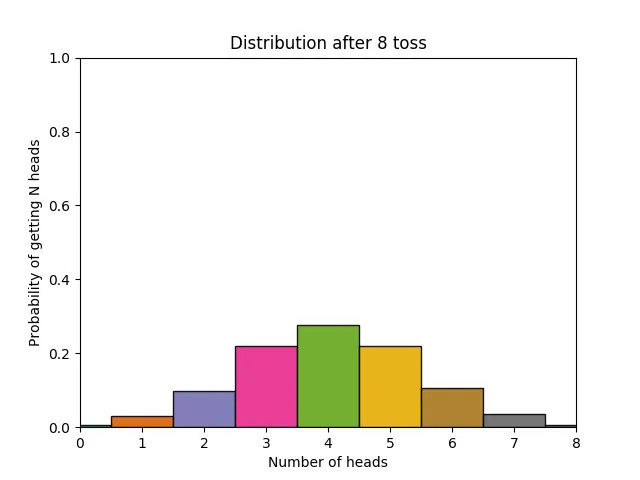
The data is normalised: the values are divided by the total number of flips. That’s why the vertical axis goes up to 1.0. Notice how the bell is symmetric and centred on the middle. This is because the coin is fair: we should get the same quantity of heads and tails. This kind of histogram is called a probability distribution.
Let’s do the same experiment with a biased coin. In our flat hunting scenario I feel quite confident of being a good flat mate and I have good references. I feel that 40% chance of having success is a good estimation of my luck. Let’s say the probability of drawing a head is 0.4.
If we do the same experiment with this biased coin we get a skewed bell! The bell is centred around 3 which is 40% of 8 (8 being the number of trials).
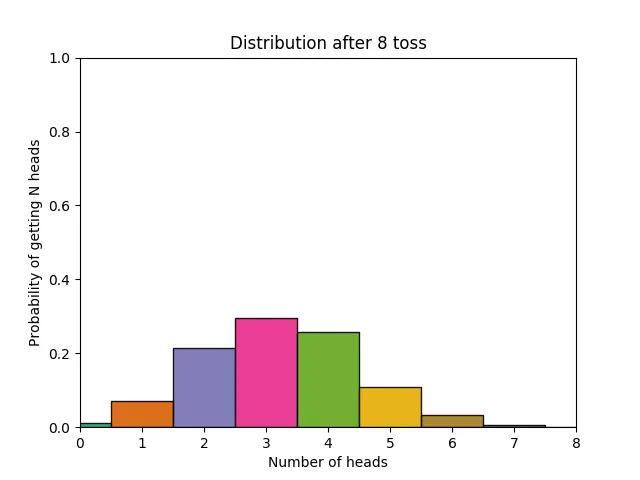
Each bar in this graph gives the probability of getting exactly N heads after tossing a coin 8 times. Now if we gradually add each bar on top of each other we see this curve.
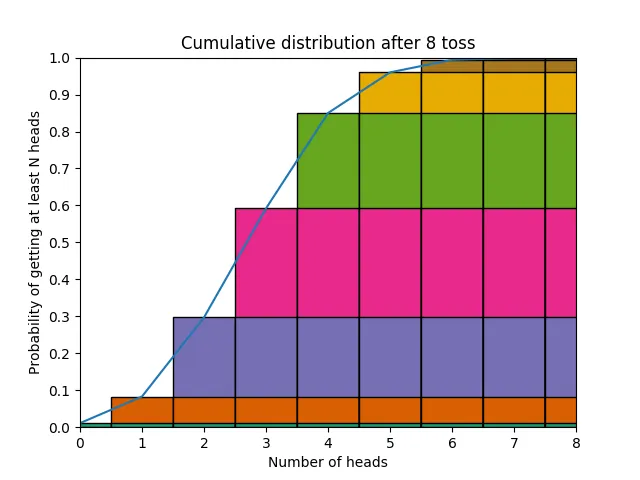
This is called a cumulative distribution function. Cumulative distribution functions (CDF) are interesting because they let you ask questions like: “What is the probability of getting at least two heads after 8 trials?”, “What is the probability of getting at most 5 heads after 8 trials?”…
CDF(0) = probability of getting no heads after 8 trials.
CDF(1) = probability of getting at most one head after 8 trials.
The probability of getting at least one head after N trials is the opposite of getting no heads after 8 trials. You can therefore write:
1 - CDF(0) = probability of getting at least one head after 8 trials.
Let’s get back to our flat hunting! What is the probability of finding at least one suitable accommodation? From the previous graph CDF(0) is close to 0.02. The answer is then 0.98 (1 - 0.02)! This is quite good! If we get in touch with 8 accommodations and assume that we have 40% chance of being picked we have 98% chance of finding somewhere suitable. My strategy of getting in touch with only 8 accommodations seems to be a good one.
Flipping a coin multiple times is described mathematically with a Bernoulli process and the Binomial distribution.
Let’s see how other scenarios work out. I’m using a Python script package with a binomial distribution function to generate this table.
from scipy import stats
for trial in range(1, 11):
    x = stats.binom(trial, 0.4)
print('{} - {}'.format(trial, 1 - x.cdf(0))| Number of viewings | Chance of getting a room |
|---|---|
| 1 | ~40% |
| 2 | ~64% |
| 3 | ~78% |
| 4 | ~87% |
| 5 | ~92% |
| 6 | ~95% |
| 7 | ~97% |
| 8 | ~98% |
| 9 | ~98% |
| 10 | ~99% |
Doing 8 viewings seems to be a good compromise! You get 2% risk of not finding something that suits you. It’s an acceptable error rate. Adding a bit more work by doing two more viewings gets you down to only 1% error.
Summary
By using this method and combining it with the Secretary Problem you get a great tool that will simplify your life and decision making. Engineer your luck by setting up a context that gives you the best chances. Using this tool you can quantify the minimal effort to do in order to get lucky. One could apply this method and life-hack to various areas. For example:
- How many companies should I reach out to in order to get a new job?
- How many dates should I go on in order to find a partner?
The trickiest part is finding the right probability p of success. In this case I picked 0.4 because it’s lower than a fair dice and that I was confident about it. You can note that the lower the probability of success the more work you have to put in.